Input Properties
It is well known that it is difficult to obtain the softening response of most quasi-brittle materials including fiber-reinforced composites. The softening response heavily depends on the set-up and test machines, which can lead to very scattered results. Consequently the choice of damage parameters for each mode becomes an open issue.
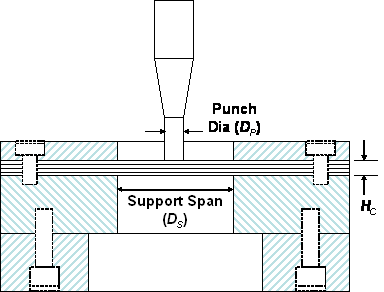
In order to determine four damage parameters in MAT 162, CCM has developed a methodology of coupling Quasi-static Punch Shear Test (QS-PST) and model based simulations. The QS-PST is conducted using a custom made fixture. A PST fixture consists of a square support-plate with a circular hole at the center, a relatively thin cover-plate with a central hole similar to the support-plate, and a cylindrical punch is depicted inFig.1.
Two sets of support-plates and cover-plates with support-span (SS) diameter ( Ds ) of 25.40 mm, and 101.60 mm are fabricated. Composite plate specimens can be bolted on the PST fixture between the support-plate and the cover plate. A right circular cylinder punch of diameter ( Dp ) 12.70 mm with a flat tip is used. The combination of one punch and two support-spans provides spans to punch ratios ( SPR = DS / DP) of 2.0 and 8.0. An Instron 1332 loading frame with a 222-kN (50 kips) load cell is used in the quasi-static tests. Displacement controlled tests are performed. The load and cross-head displacement data are acquired using the Instron Series IX software.
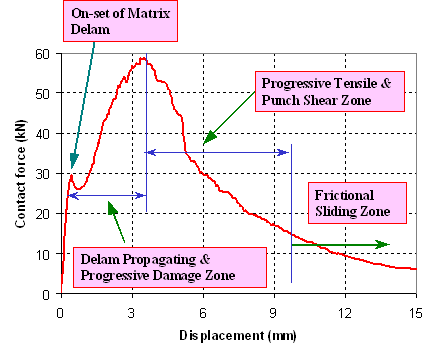
It has been observed that the punch shear test is repeatable because this test method involves the volumetric deformation and damage, and represents the global behavior of the composite laminate. Fig.2 shows the load-displacement curve ( SPR = 2.0 ) of a 22L Baseline laminate incrementally loaded up to five different displacement levels designated by letters A to E. In between displacement levels B and C, initiation of delamination and formation of a plug through fiber shear under the punch is observed. In the displacement range between C and D, complete formation of the plug and bending of the rest of the laminate ahead of the plug occurs. Tensile fracture and push out of the plug is observed between displacement levels D and E.
To model the punch shear successfully, it is necessary to understand the evolution of damage during the experiments and how they are simulated in the material models. The following are the sequence of damage modes for the material tested: 1) Delamination initiation; 2) Delamination propagation; 3) Fiber compression and shear failure; and 4) Fiber tension and shear failure. Delamination initiates due to high transverse shear localized around the punch and propagates due to transverse shear loading. A drop in the load-deflection plot is observed (points A in Fig. 2). During delamination propagation, the plate carries load and the contact force increases but with a lower slope of load-displacement curve indicating loss of flexural and shear stiffness due to delamination. After the delamination has extended to the full length of the plate and the plate has undergone large displacement, fiber failures begin to occur. This is characterized by continuous drop in the load-displacement curve beyond the maximum load point (C). Due to stress stiffening effect arising from large deflection, the bending deformation reduces and the localized transverse shear stress begins to increase. At this time, either pure fiber-shear or combined fiber tensile/shear failure may occur. The localized transverse shear stress is highest just beneath and around the punch and decreases across the thickness. Also, the plate has large tensile stress due to bending and stretching across the thickness. The 22L composite plate showed similar behavior in case of both the support spans 25.4 mm ( SPR = 2.0 ) and 101.60 mm ( SPR = 8.0 ) diameter plates. Tensile failure of fibers can occur at the bottom most layers during the time when punch is progressing and the upper layers have undergone shear failure.
The first drop at point A in Fig.2 corresponds to delamination initiation and propagation. There is no other visible type of material failure occurring at this point, and a correct combination of interlaminate shear strength and softening parameter m4 should be able to capture the delemination initiation region (with displacement ranging from 0.4 to 1.5 mm in case of 25.4 mm SS), so that a very small range of values for m4 can be determined by comparing with the experimental data of both support-spans. User can choose one ‘optimal’ value for m4. It should be noted that changing in other properties and softening parameters does not affect the response in the range of delamination initiation.
Softening parameter m3 is associated with the response of material in through-thickness direction compression and punch shear. From experimental observation, segment BC in Fig.2 is dominated by compression and shear. With the optimal m4 value, one can determine the softening parameter m3 by varying its value to match the experimental force-displacement curve ranging from B to C. Consequently one can get an ‘optimal’ value for m3.
Tensile softening behavior of material is governed by parameters m1 and m2 (one can take m1 = m2 for fabric). It is believed that the post failure region (beyond the peak point C) is a coupled shear and tension failure. Similarly, one can get an ‘optimal’ value for m4.
It should be noted that there is no unique value for each parameters can be determined from this procedure, and it is based on the user’s decision/experience to determine these ‘optimal’ values. Details can be found in Xiao et al., 2005.
Fig. 1 . Schematic of a punch shear test fixture

Fig. 2 . Punch shear behavior of PW s-2 glass/sc15 composite laminates


